
Spring Survey Highlights Student Perspectives
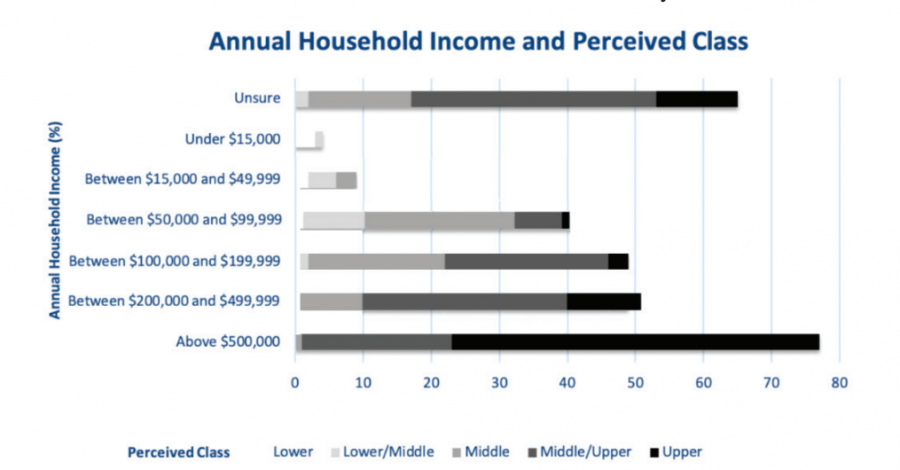
Student responses to “What is your primary household’s net annual income?” and “What socioeconomic class do you consider your household within?”, showing an upward-skewed perception of class
On May 22, 2019, the Circle Voice sent out a survey to all students in order to gather valuable information about the Grotonian community.
Marianne Lu ’19, Editor-In-Chief of the Circle Voice last year, said, “We wanted to have a sense of how people identify and stand on certain issues, and hopefully start a tradition so the survey could be replicated every year.”
The schoolwide survey was divided into seven sections: general, politics, wellness, sex, drugs and alcohol, school, and discipline. The Circle Voice hopes that the survey provided a platform by which students were able to anonymously convey their thoughts and experiences.
General
The plurality of the 298 respondents were boarding, female, white, and/or not a recipient of financial aid. Despite the school’s Episcopalian history, the number of atheist and agnostic students was greater than that of Christians. Following atheists and agnostics, the most popular religious groups were Christians, Catholics, undecided students, and Jews.
As expected, the majority of those who perceived their families to be upper class stated annual household incomes exceeding $500,000, while the majority of those considering themselves to be middle class stated incomes between $200,000 and $499,999. It is important to note that a significant number of students said they were unsure of their socioeconomic standing.
According to Pew Research Center, a nonpartisan think tank, any three-person household living in the Greater Boston metropolitan area that earns more than $150,000 yearly is deemed to be of the upper income class. In general, the center estimates lower class incomes to be less than $45,200, middle class incomes to be in between $45,200 and $135,600, and upper class incomes to be greater than $135,600.
Grotonians’ standards of class thus seem significantly higher than national metrics; by Pew’s definition, less than 10 percent of Groton households reported in the survey would be of the lower income class, whereas over 20 percent of students reported their households to be of the lower income class in the survey.
Politics
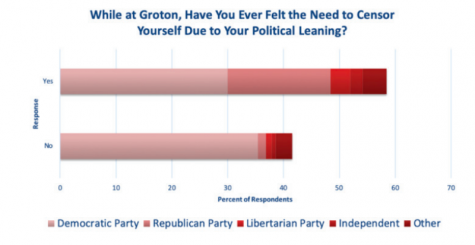
The political party that students most identified with was the Democratic Party, followed by the Republican and Libertarian Parties.
With a 65 percent Democrat-majority population according to survey results, the common consensus among students regarding controversial topics like affirmative action, abortion, college affordability, immigration, and environmental sustainability tended to lean towards the left side of the political spectrum. In sync with this liberal majority, 70 percent of respondents identified as feminists, 50 percent supported the creation of an all-gender dorm, and 75 percent supported the Black Lives Matter movement.
However, Groton’s left-leaning nature likely contributes to why about 60 percent of survey participants have felt that they needed to self-censor their more conservative opinions.
Wellness
When compared to the average American high schooler, Grotonians get about the same amount of sleep but spend significantly less time on social media applications.
Although the survey average of 6.7 hours was similar to the national average, it was still drastically lower than the recommended 9-9.5 hours of sleep per night according to Johns Hopkins Medicine.
Grotonians were below the national average, however, in time spent on social media. The survey average was two hours a day, compared to the national average of 153 minutes according to Statista, a database company.
These two trends may result from Groton’s status as a top-ranked academic school with a rigorous curriculum according to rating websites like Niche and Business Insider. A heavy load of schoolwork may even take away time for meals, as 72% of respondents said that they have skipped meals for this very purpose.
Sex
42 percent of respondents reported that they have dated someone on campus, and almost 80 percent said they perceived a “hook-up culture,” or an environment that encourages short-lived yet intimate relationships at Groton. 40 percent reported to have experienced pressure from this culture and over half of survey participants said they have had at least one “hook-up,” defined on the survey as “kissing and any activity more sexually intimate.”
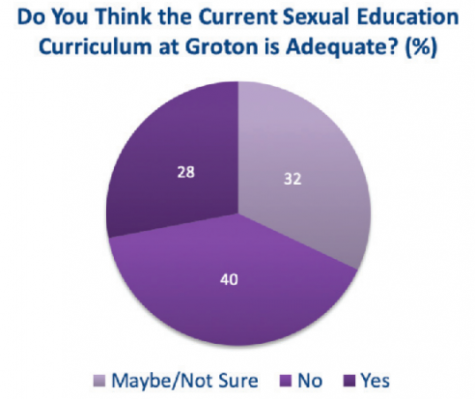
Moreover, 40 percent of students say that sex education at Groton is inadequate; students want to be equipped with a better understanding of romantic interactions.
Although the Counseling Department has made efforts to incorporate more sex ed in recent years, Annabel Kocks ’20 explained, “Personally, I agree with the 40% of students… We might have talked about sex-ed once briefly in third form, but I don’t remember anything from that conversation. Everything I know comes from what I learned in middle school and from my friends.”
Drugs and Alcohol
Notably, survey respondents believed drug and alcohol consumption was more frequent than it actually was according to survey results. Respondents expected nearly 40 percent of students to have regularly vaped on campus. However, this figure turned out to be a much lower 10 percent. Marijuana and alcohol data exhibited similar patterns. Overestimated assumptions notwithstanding, 85 percent of students discredited the existence of a “drug culture” at Groton.
School
Students completed on average 192 minutes of coursework per school day, which was almost an hour longer than the national average of 145 minutes according to a USA Today survey. Second formers found themselves studying for an average of two hours a day, whereas fifth formers studied for 3.8 hours on average, according to survey results.
Interestingly enough, the average estimation of the entire school’s GPA was 85 percent, three percent less than the actual average GPA of all respondents: 88 percent. Furthermore, students reported a seemingly low average 6/10 satisfaction level with their grades.
Discipline
The two most remarkable trends in the discipline section were about intervisitation and privilege favoritism. An overwhelming 82 percent of students agreed that intervisitation policies should be more lenient, a position that may be supported by the fact that 34 percent of respondents say they have already illegally intervisited.
Secondly, 73 percent of survey participants said that Groton’s disciplinary system favors students of privileged socioeconomic backgrounds. Jiacheng Kang ’22 understands why many students may think so but says, “The disciplinary system tries to give people at least one chance and the mercy of the system can oftentimes be attributed to a student’s privileged background. Then the story [of privilege favoritism] can spread as a contagious rumor and sway the opinion of [students].”
Ultimately, the survey served both to reaffirm and disprove pre-existing assumptions. Results corroborated the validity of Grotonians’ liberal leanings and perceived existence of a “hook-up culture.” On the other hand, results contradicted the overestimated percentages of regular smokers and drinkers, helping to verify a relatively drug-free culture at Groton.
Another function of the survey was to identify students’ concerns. Per survey results, respondents were most concerned about politics, skipping meals, sex education, grades, intervisitation policies, and the disciplinary system. The Circle Voice hopes that the administration can use these results to work alongside students in improving campus life.